Benny started an interesting experiment that was right up my alley. He wanted to know the affect that sugar had on a SD starter. I am always looking to enhance the yeast in my starter. So here I go…

Images above and below show calibration before any readings were taken.
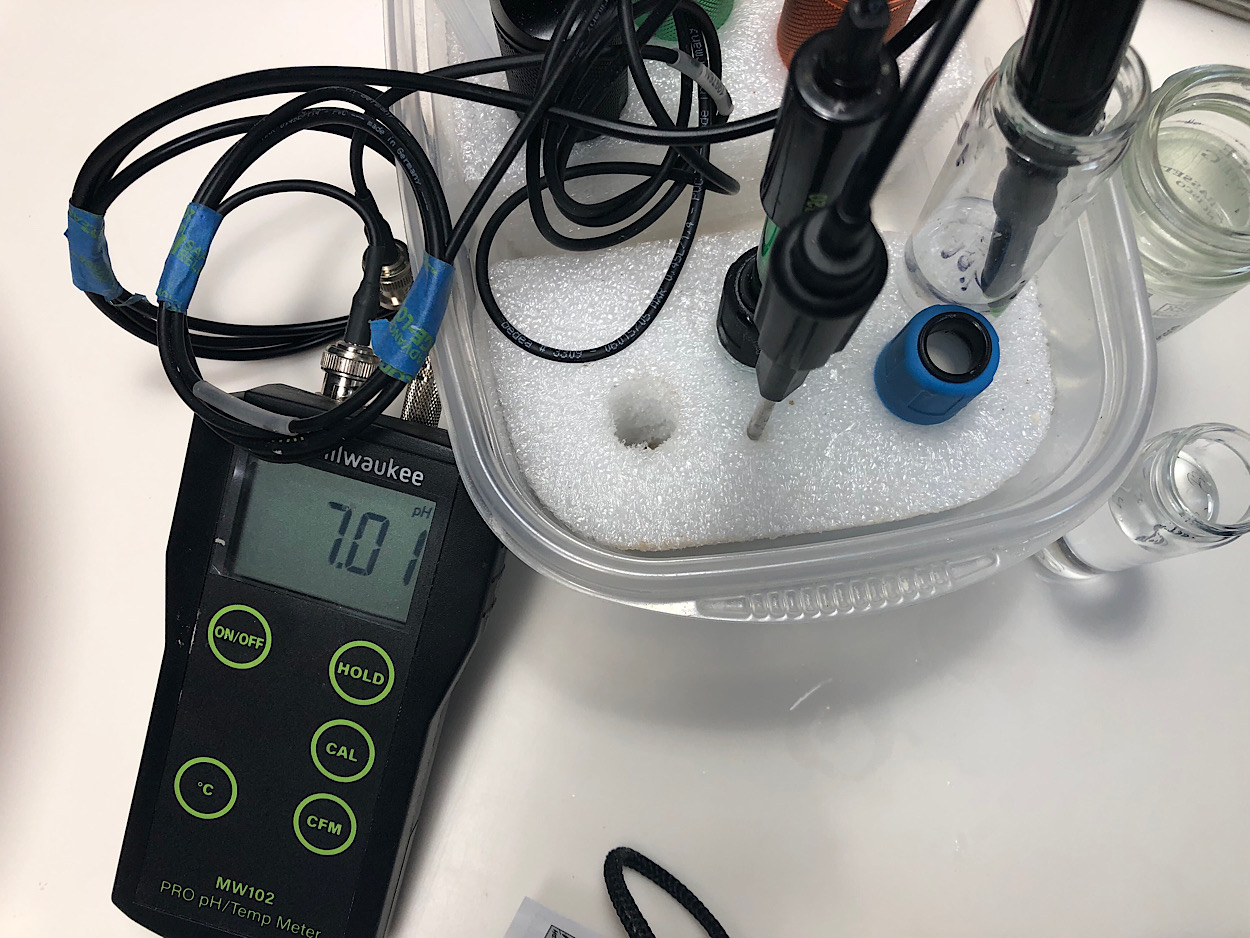
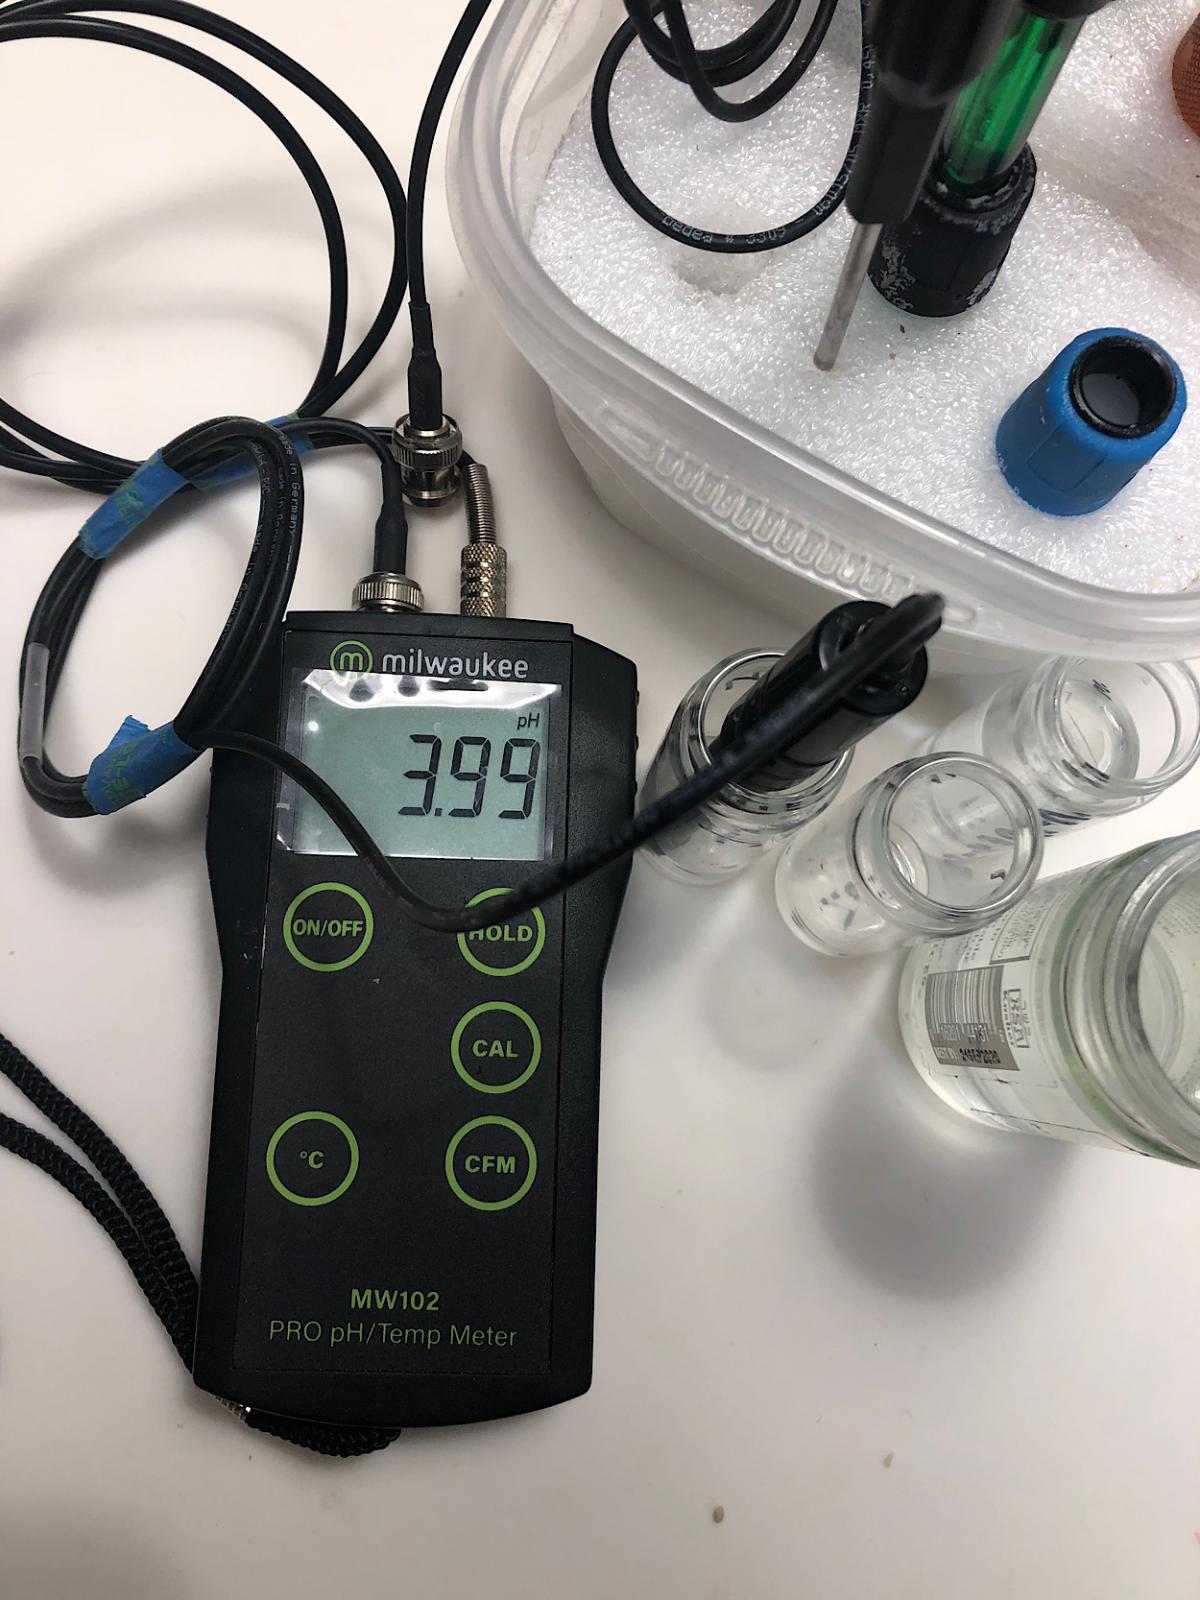
Image below shows pH reading of original starter after removal from fridge and warmed on counter for 2hr.
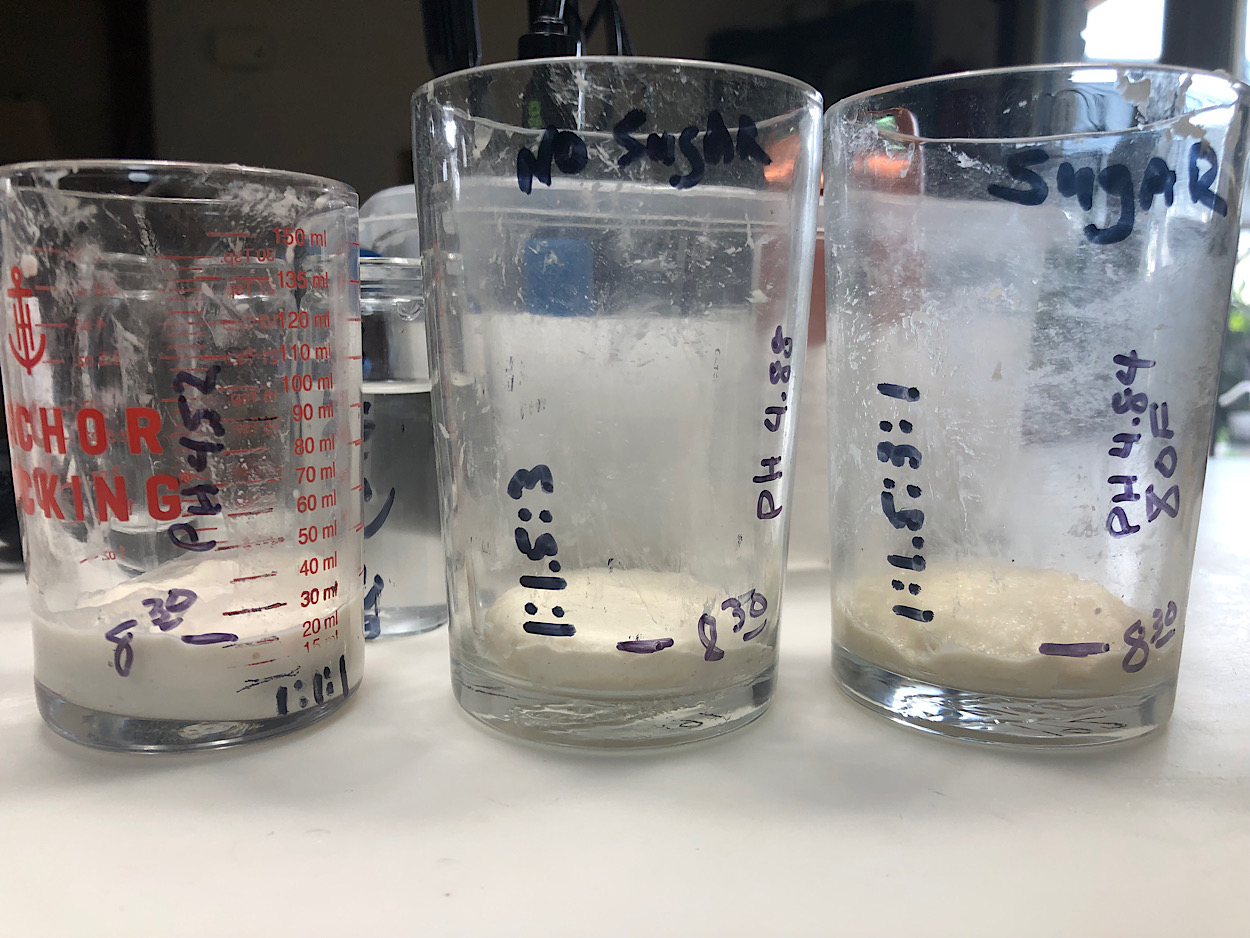
Below is pH of standard refreshed starter, mixed 1:1:1. NOTE - all feed flour was high protein white.
Below - No Sugar pH. Mixed 1:1.5:3 (~50% hydration)
Below - 33.3% sugar when calculated against the feed flour. Mixed 1:1.5:3:1 (starter:water:flour:sugar)
All 3 starter will be covered and placed in the proofer that is set to 80F.
Quadruple rise after 4hr on 1:1:1 - 100% hydration w/no sugar
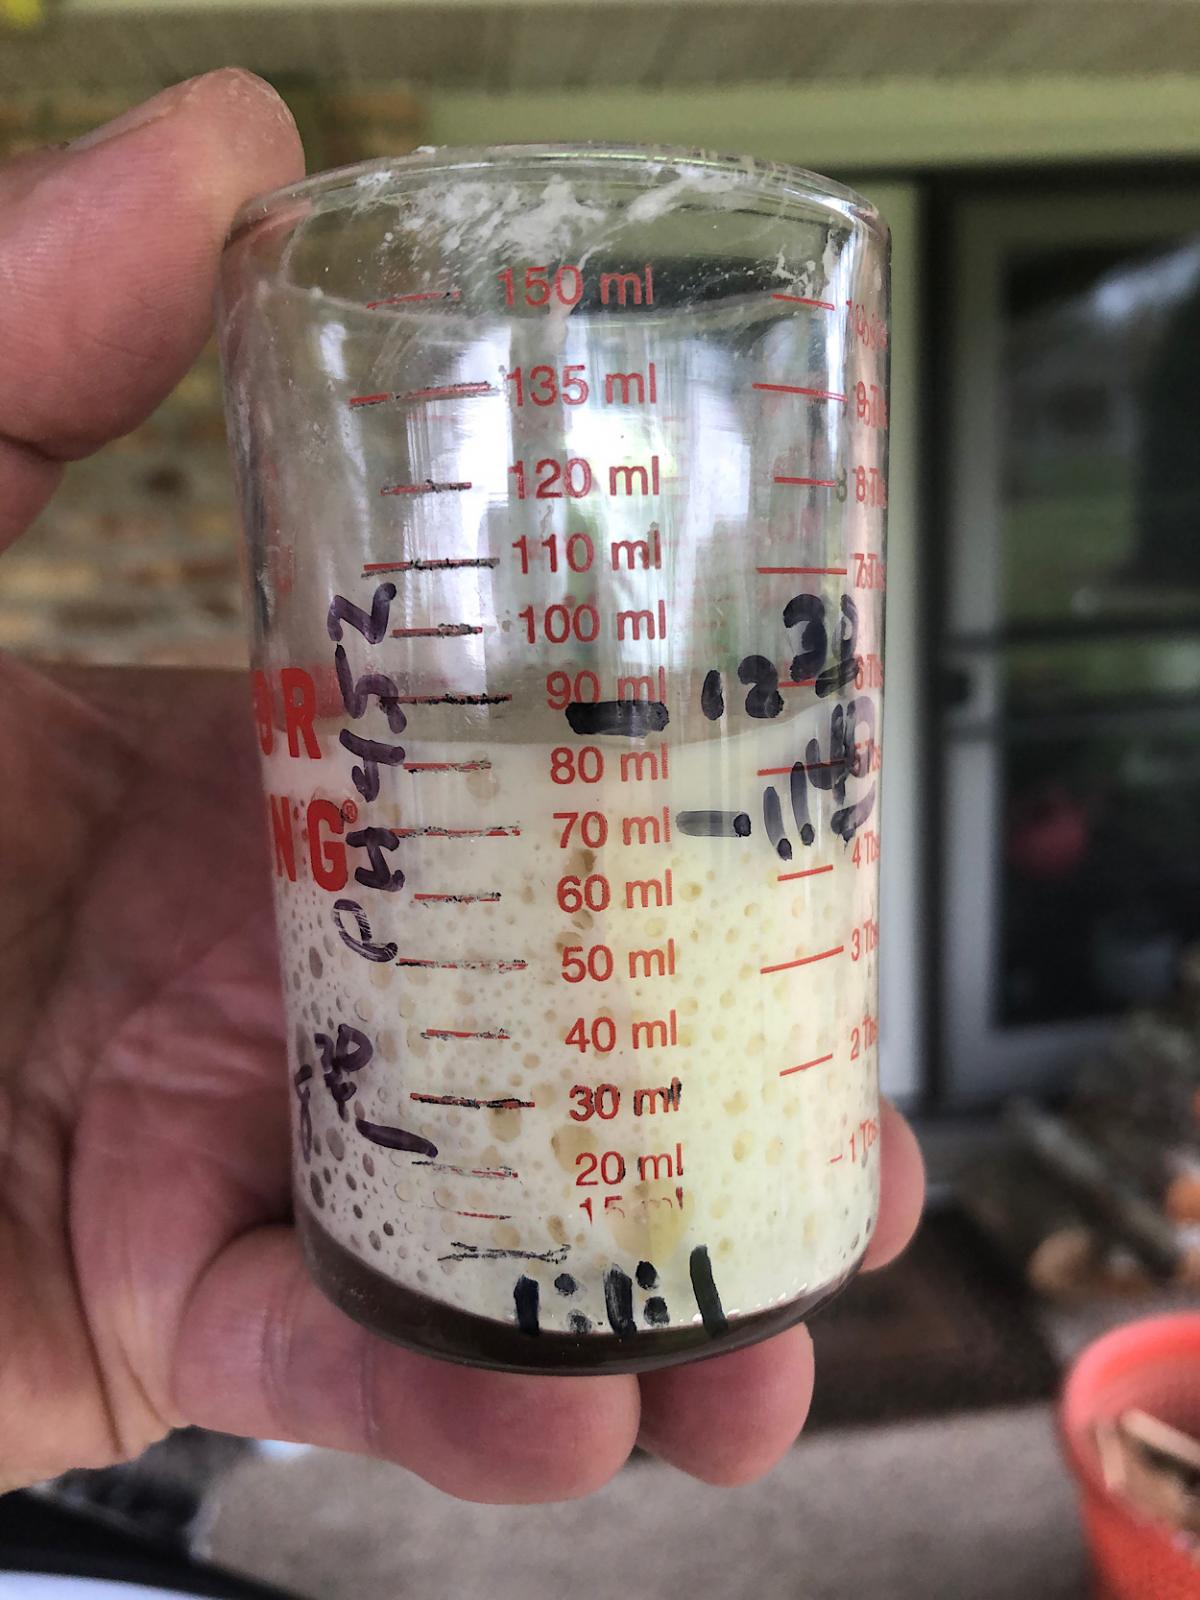
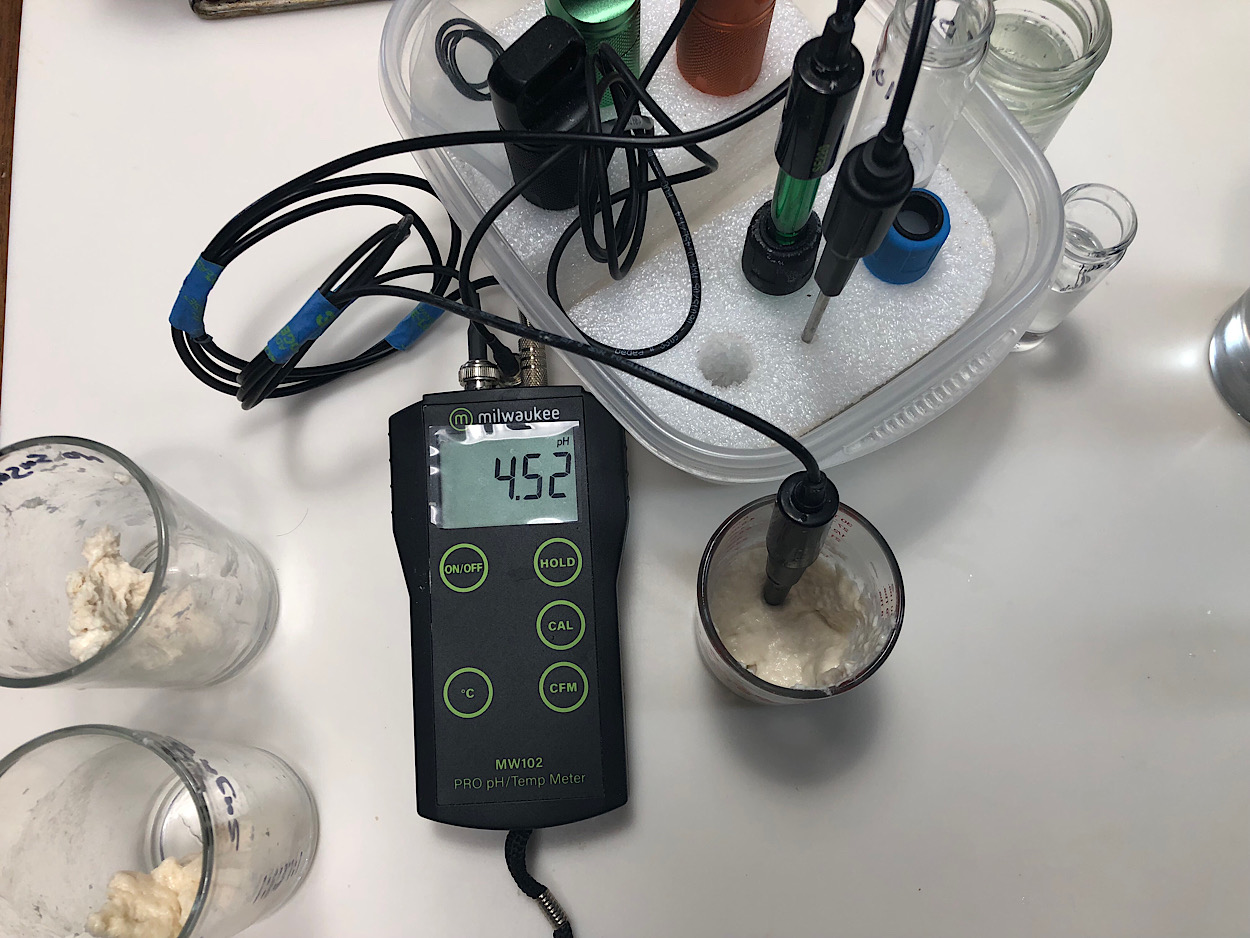
pH at refresh was 4.52 - At maturity (image below) 4.19
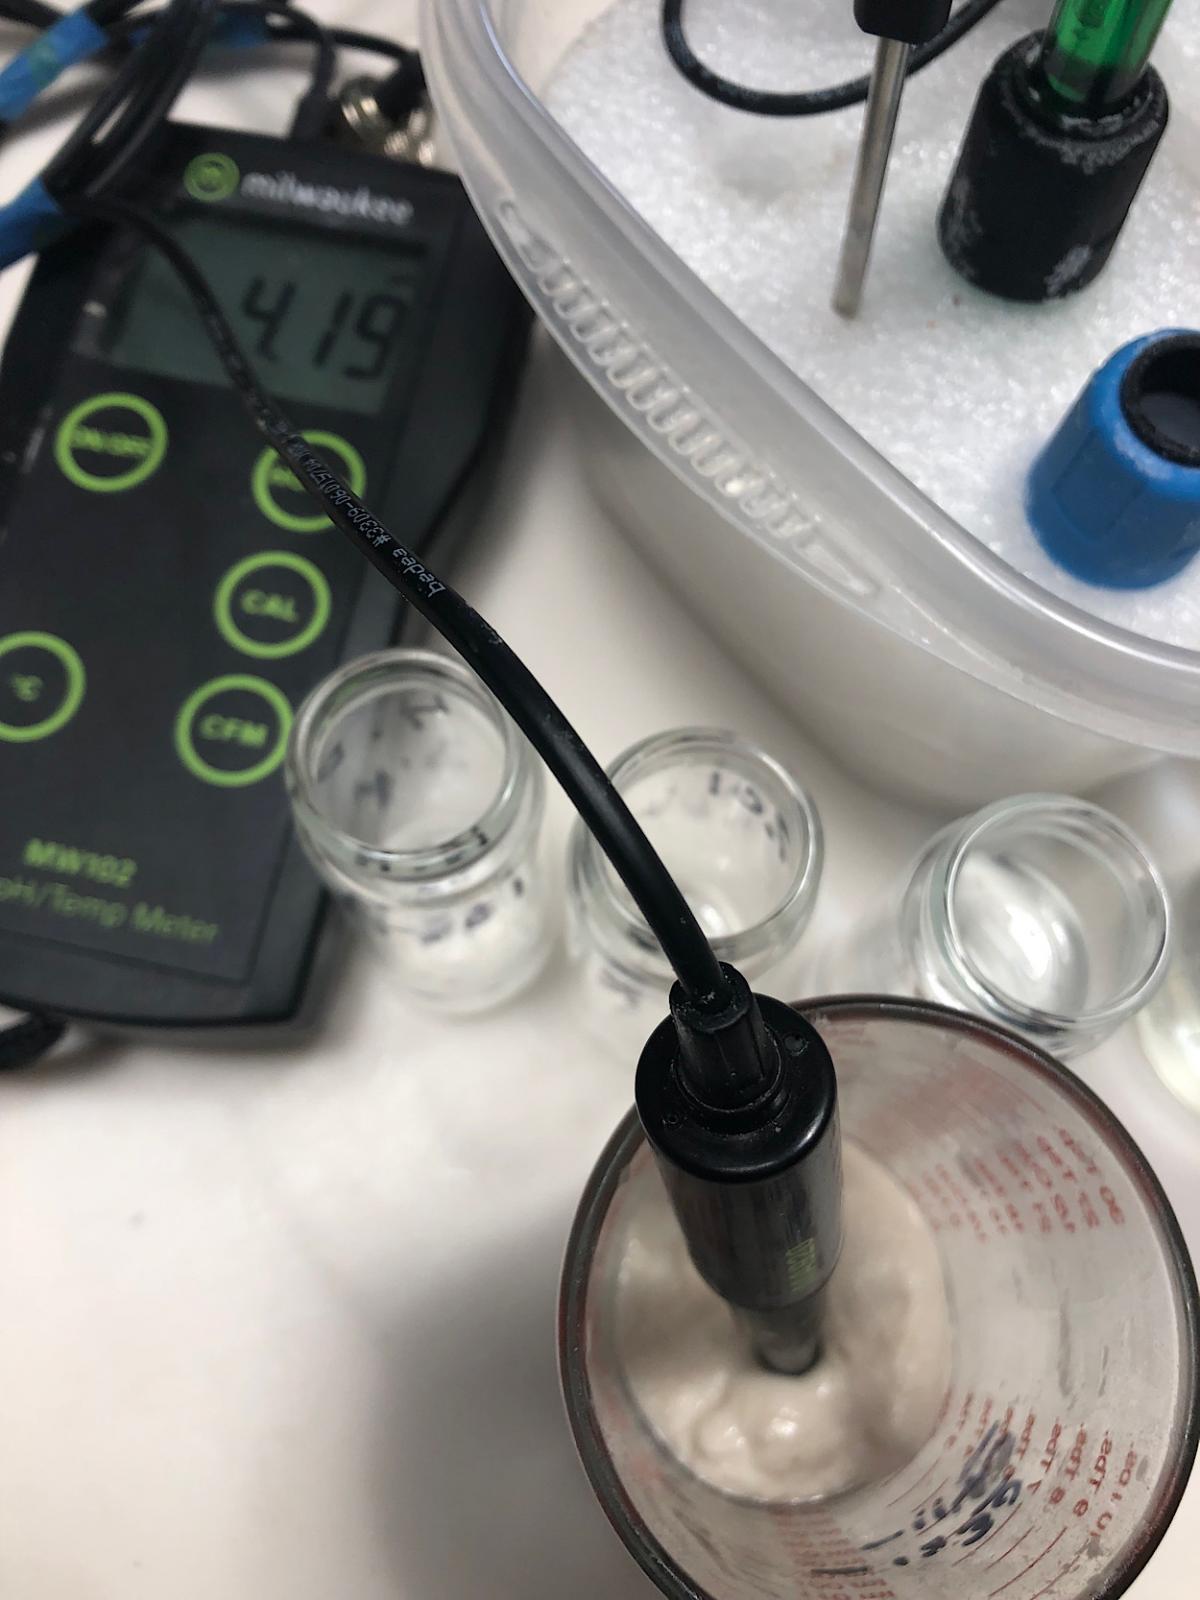
1:1.5:3 matured in 6hr, ~4x rise
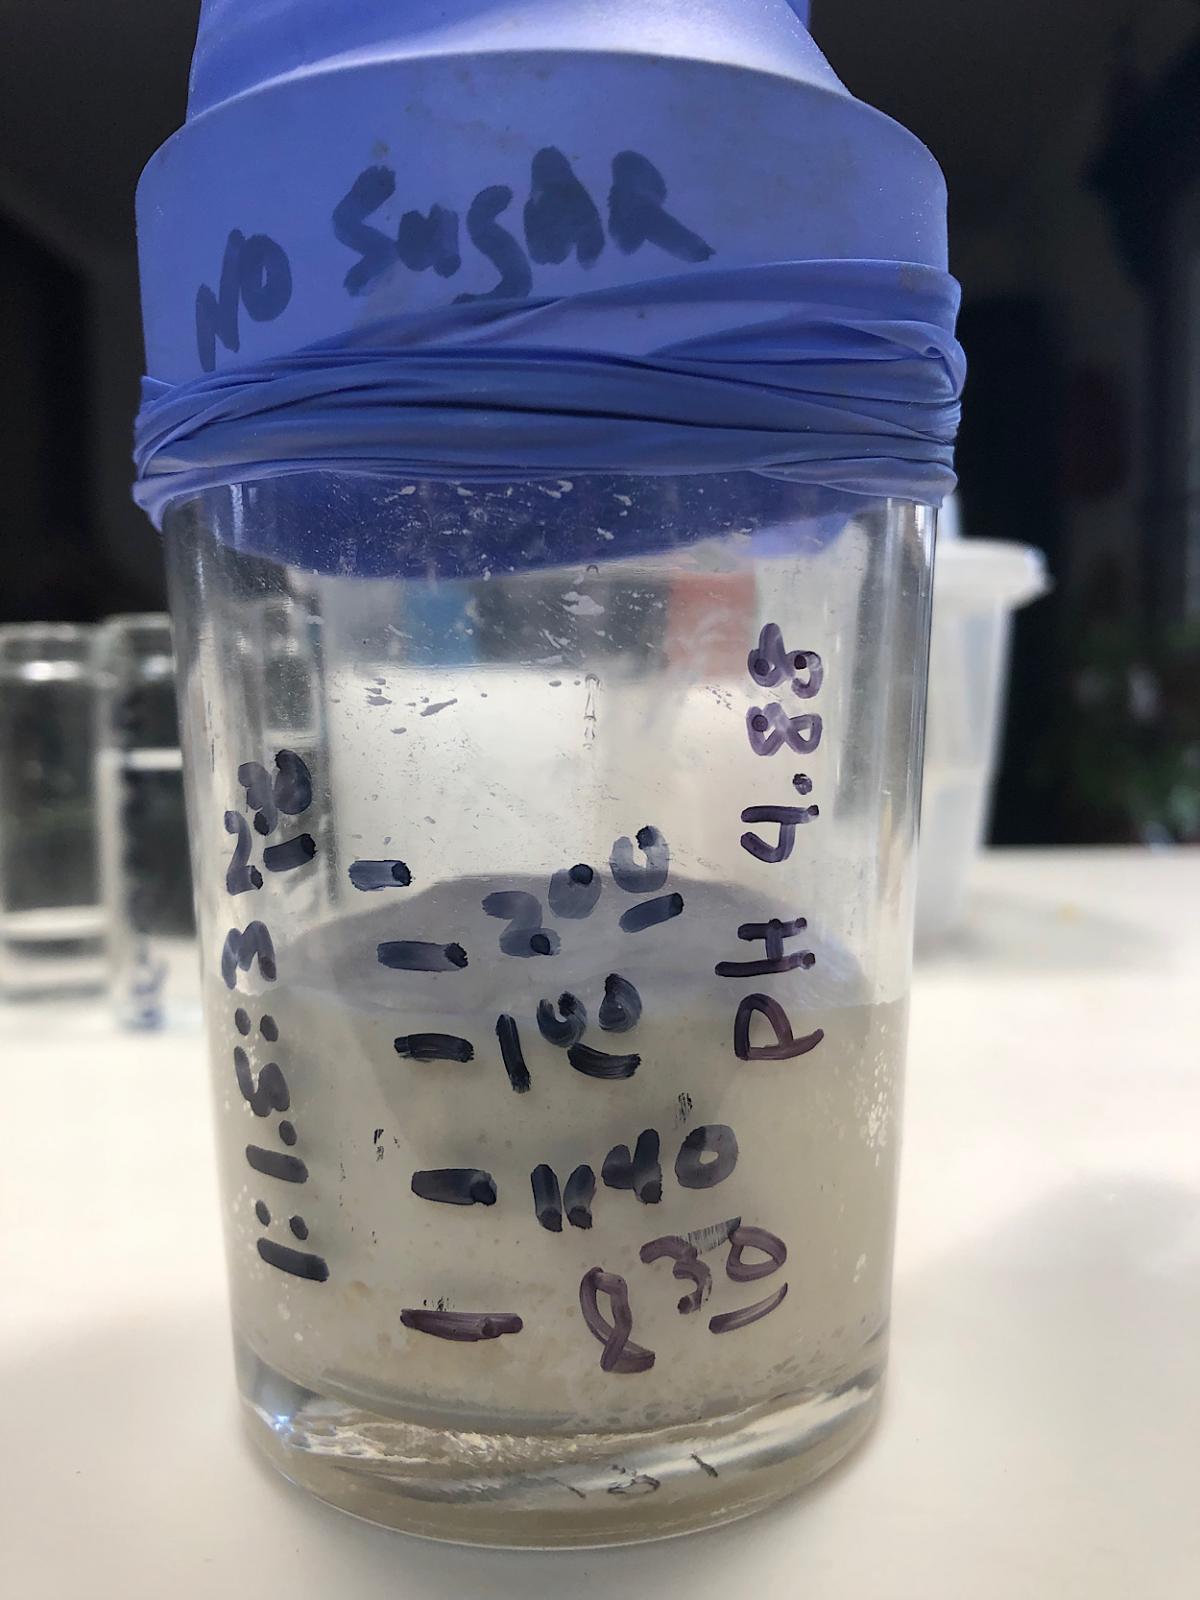
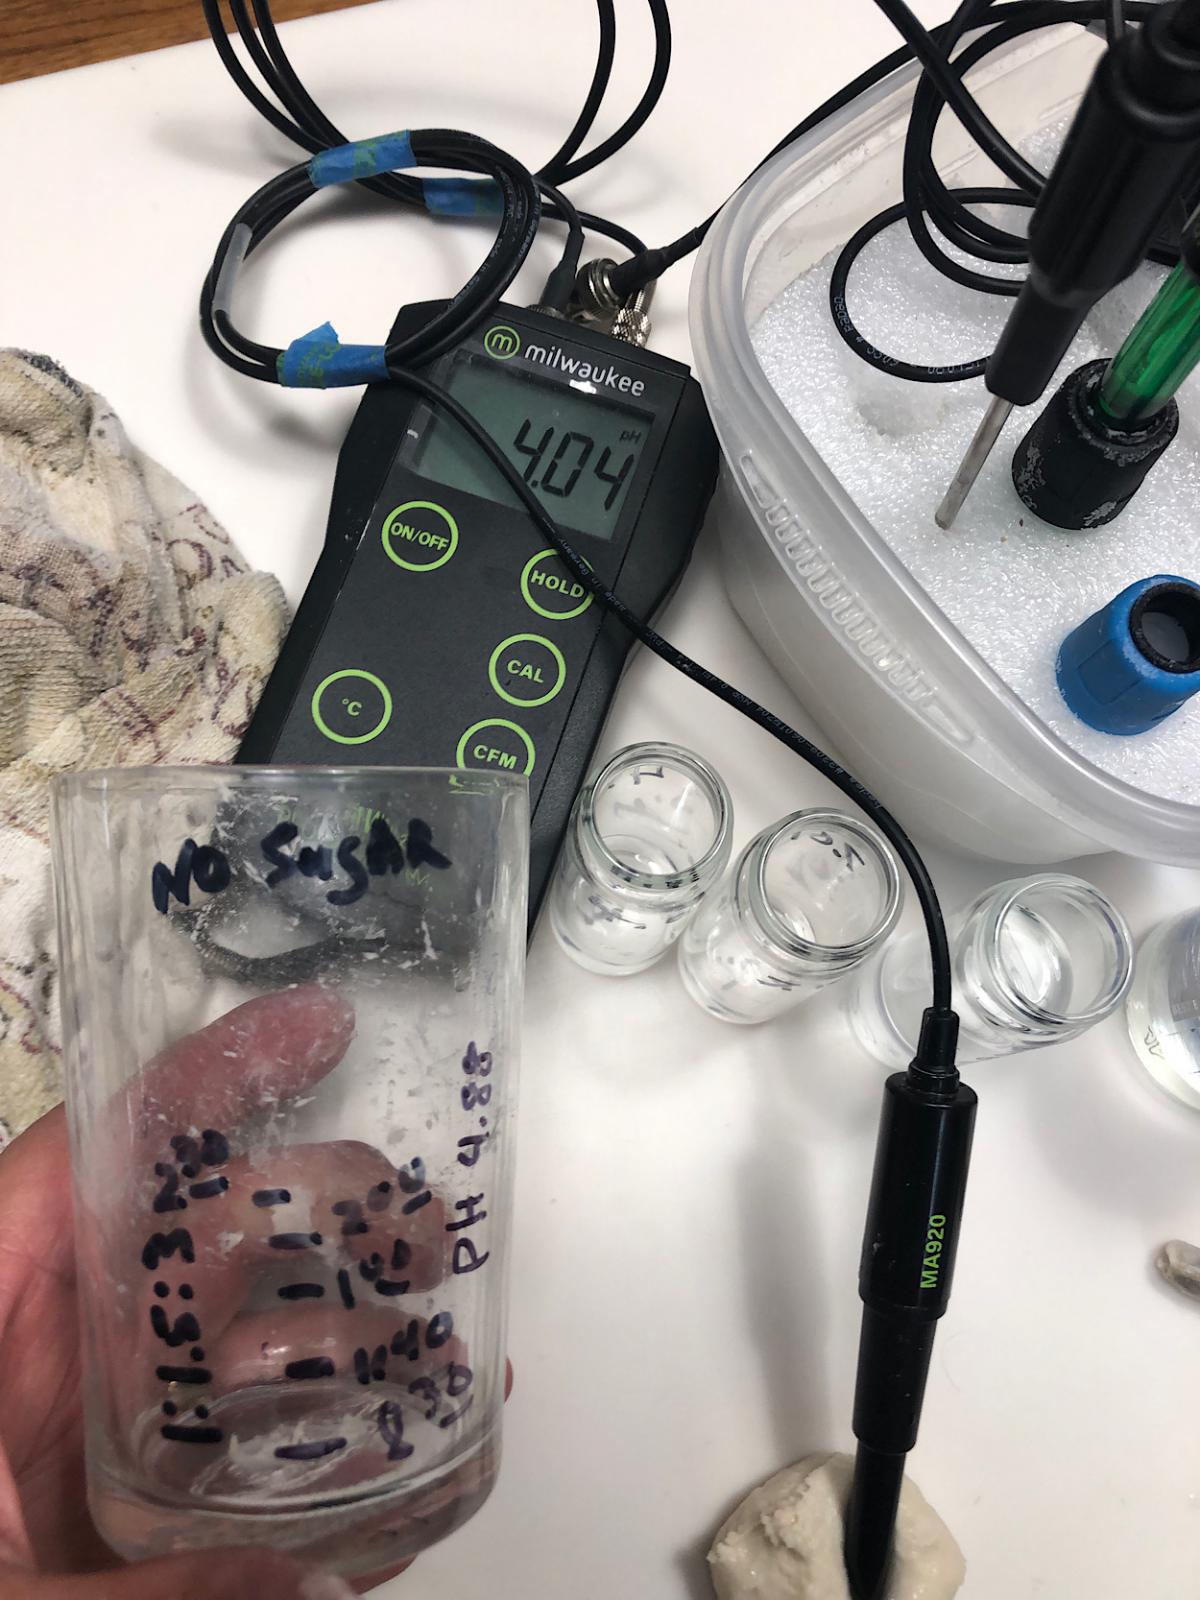
pH at refresh was 4.88 - At maturity (image below) 4.04 ~50% hydration w/no sugar
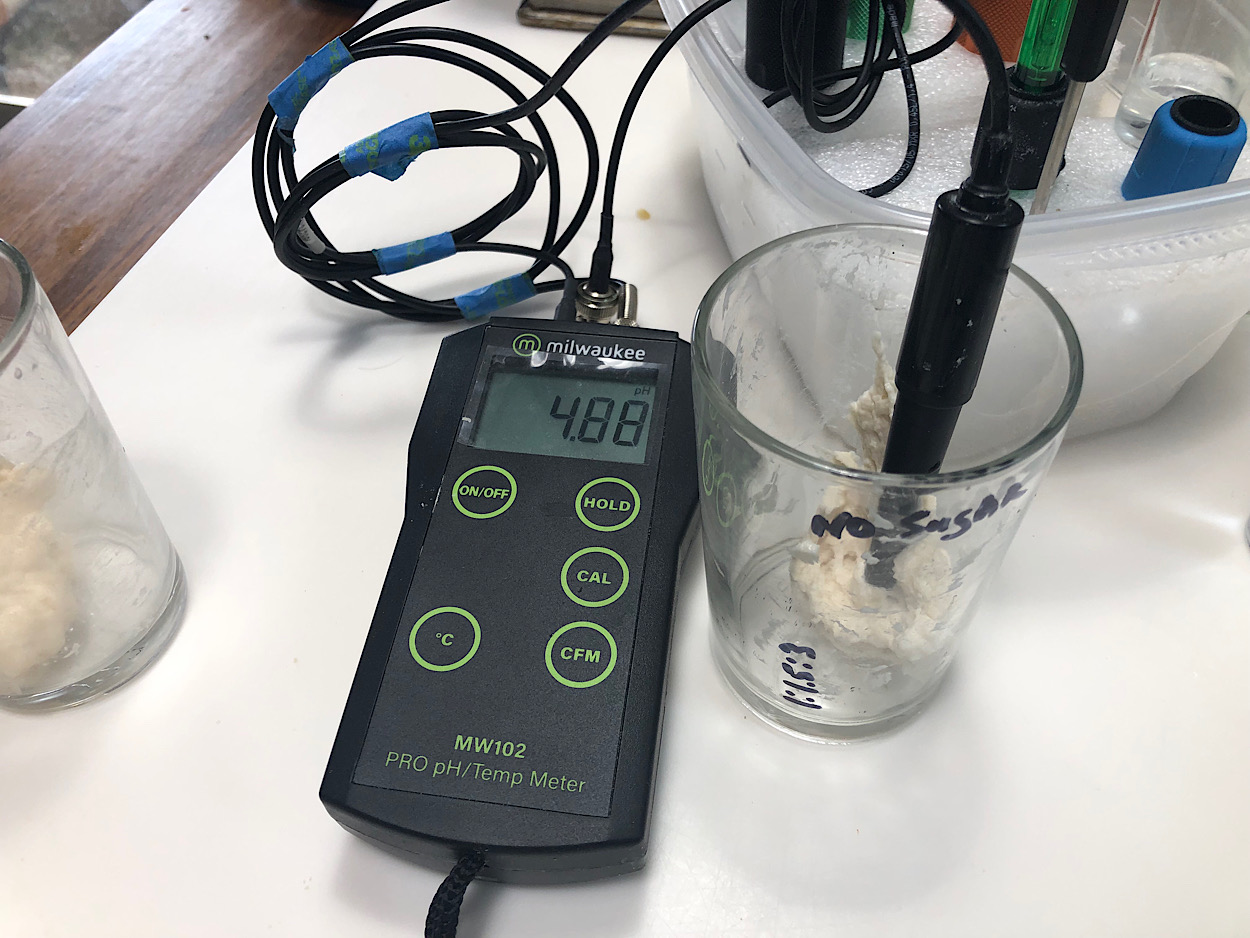
1:1.5:3:1 (starter:water:flour:sugar) ~3.25 rise after 7hr
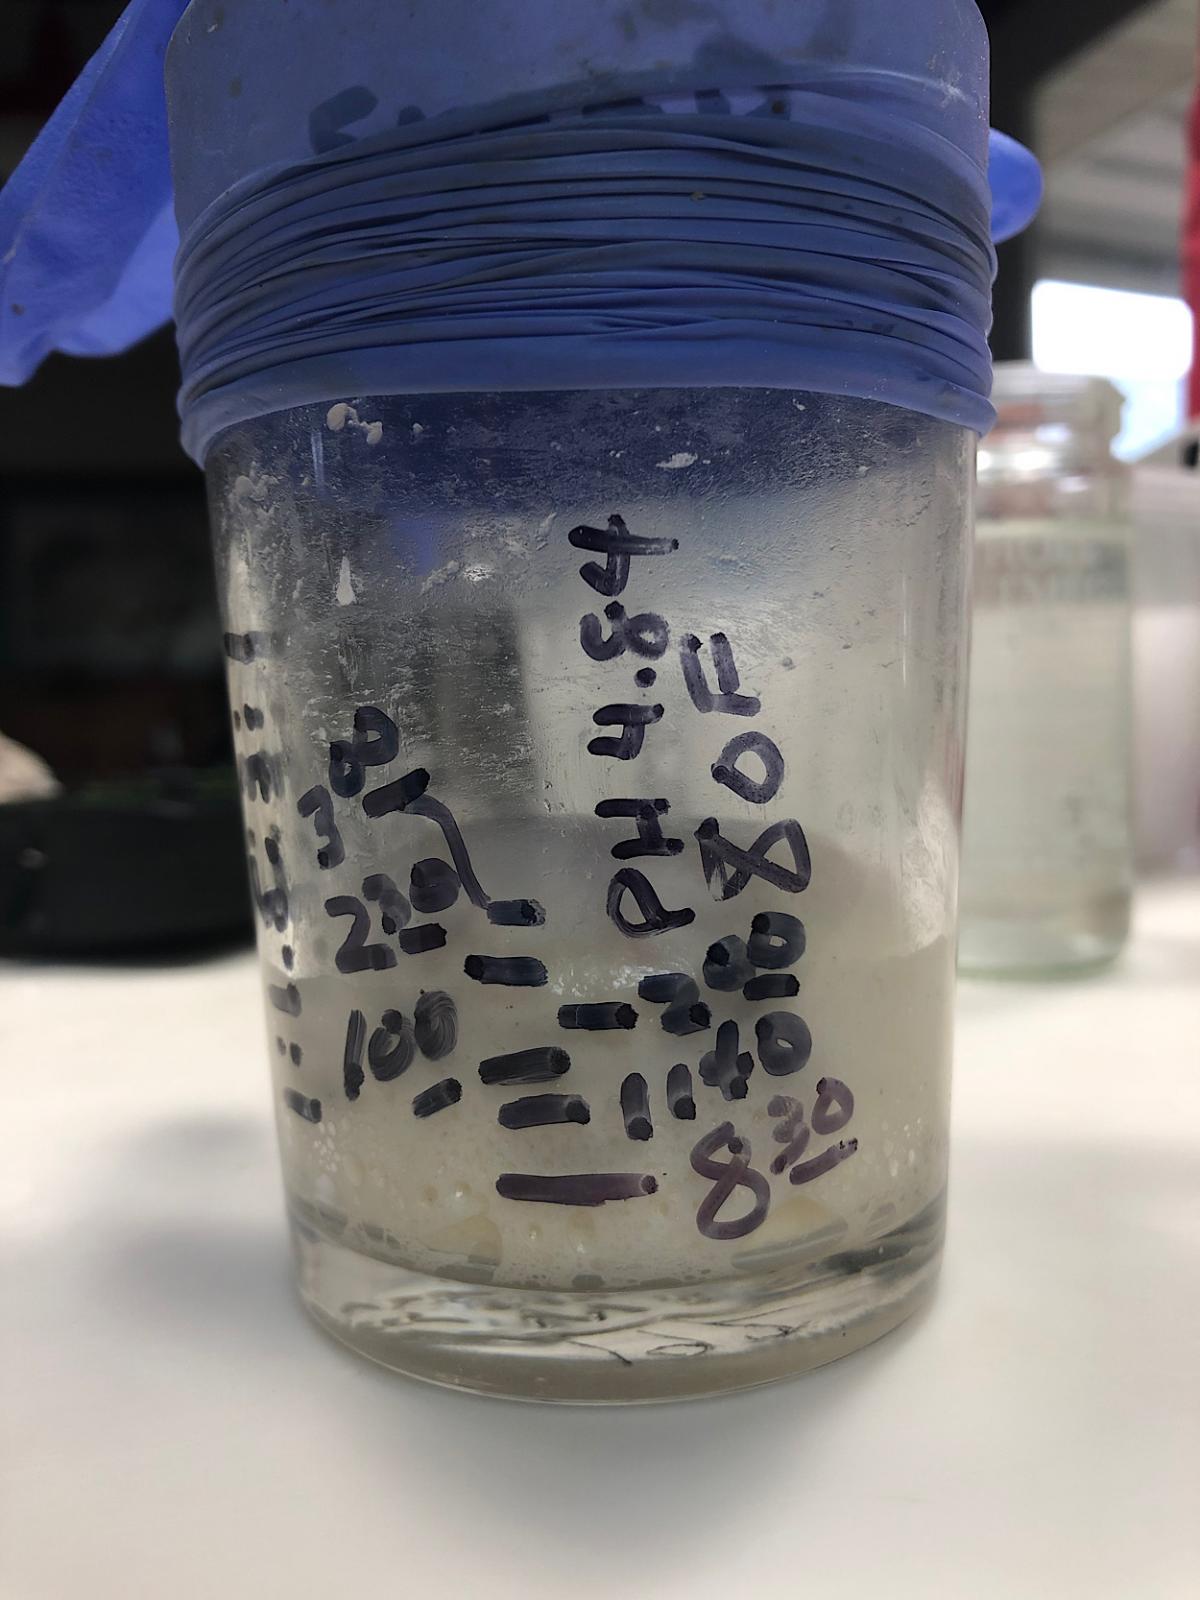
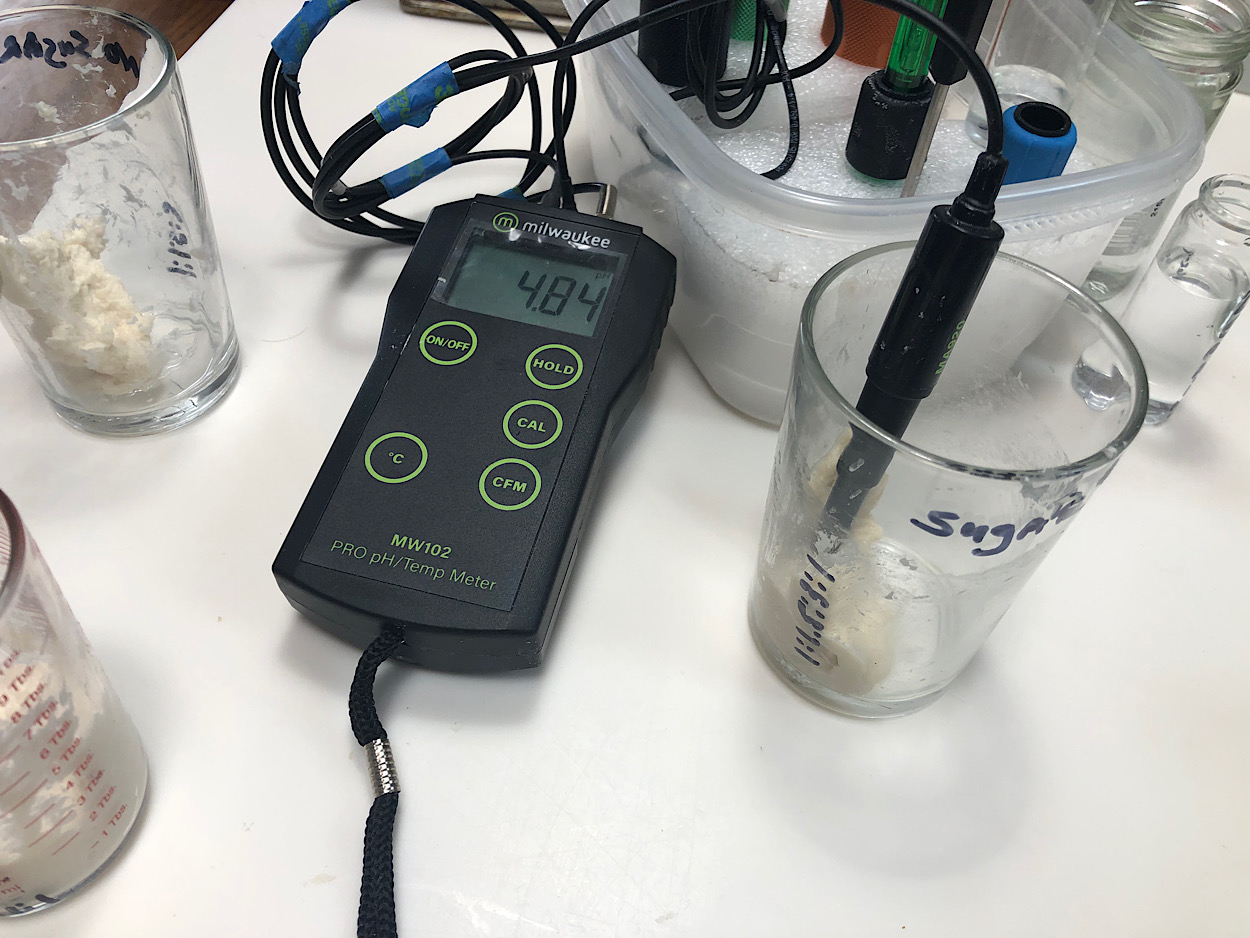
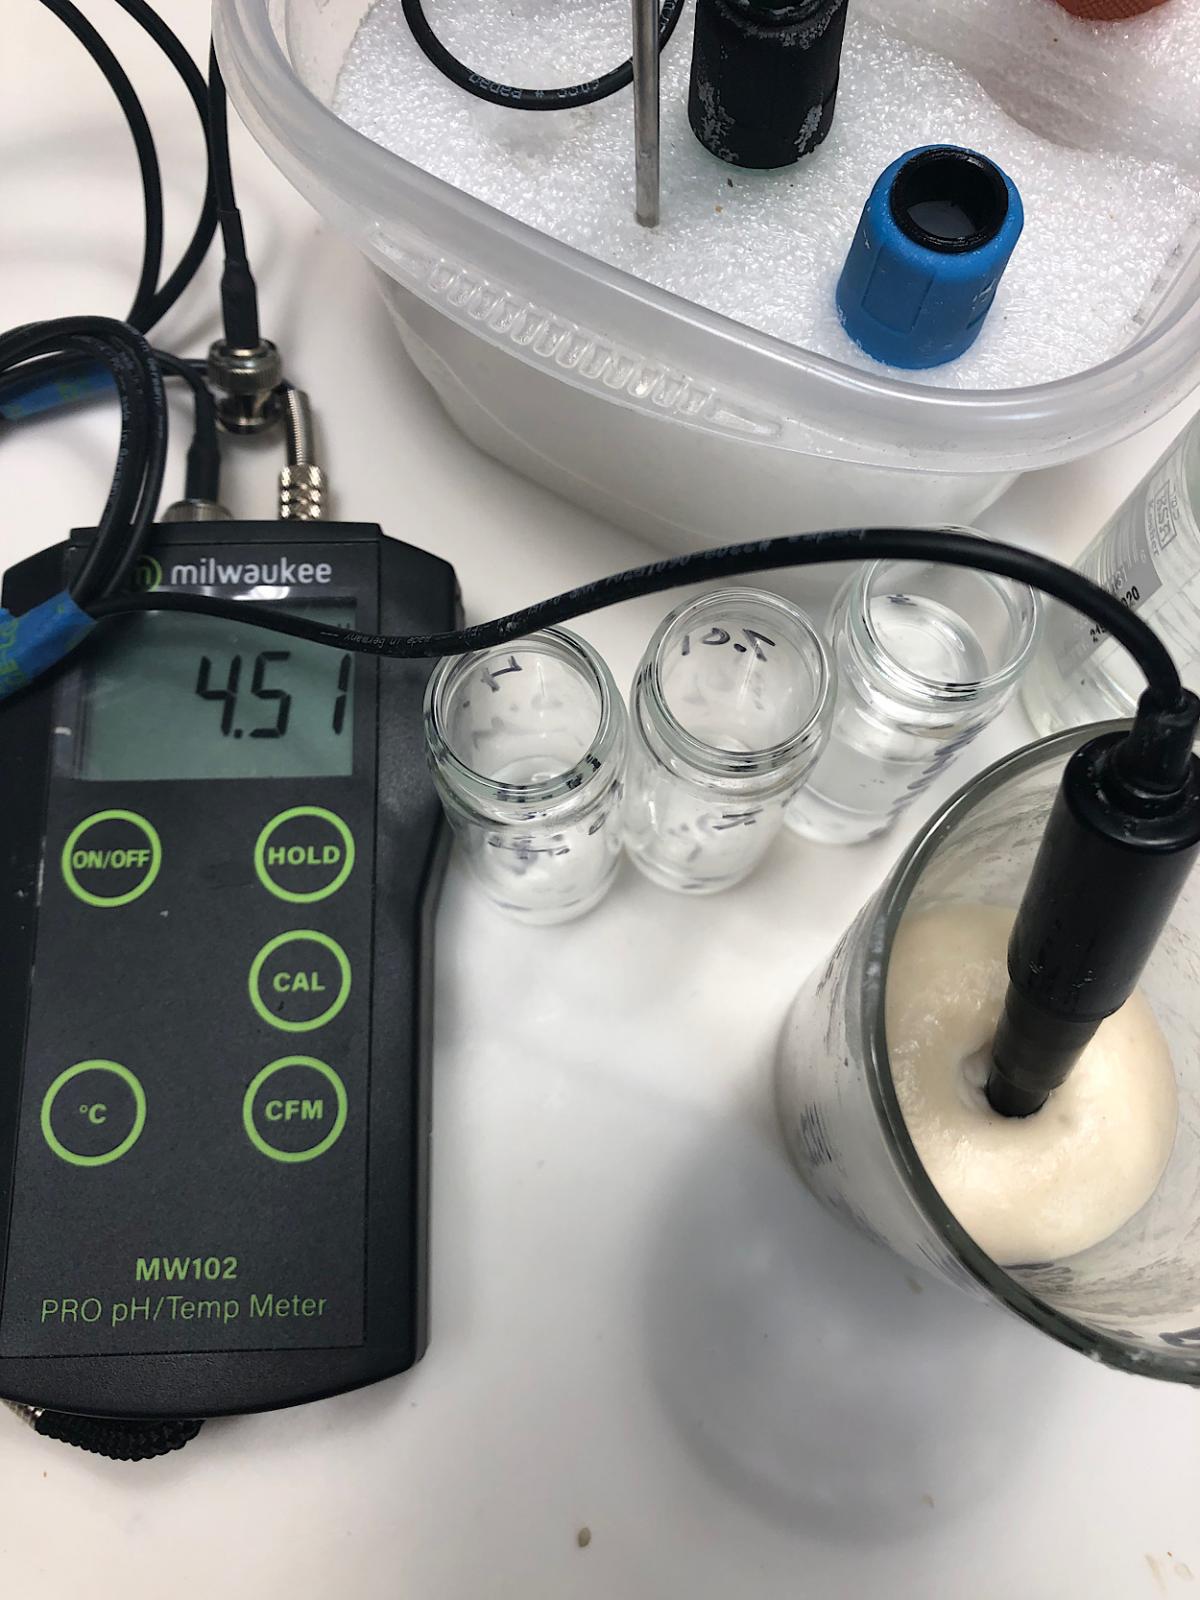
pH at refresh was 4.84 - At maturity (image below) 4.51 ~50% hydration w/sugar
After the testing was complete, the probe was checked against a calibration solution of 4.01.
Interesting
The original 1:1:1 lowered pH by 0.33
The stiffened starter 1:1.5:3 lowered pH by 0.84 (I wonder if the extra 2hr it took to mature this starter over the 1:1:1 account for the large drop in pH)
The sugared starter 1:1.5:3:1 lowered pH by 0.33
NOTE - all 3 starters fermented @ 80F
Another interesting observation -
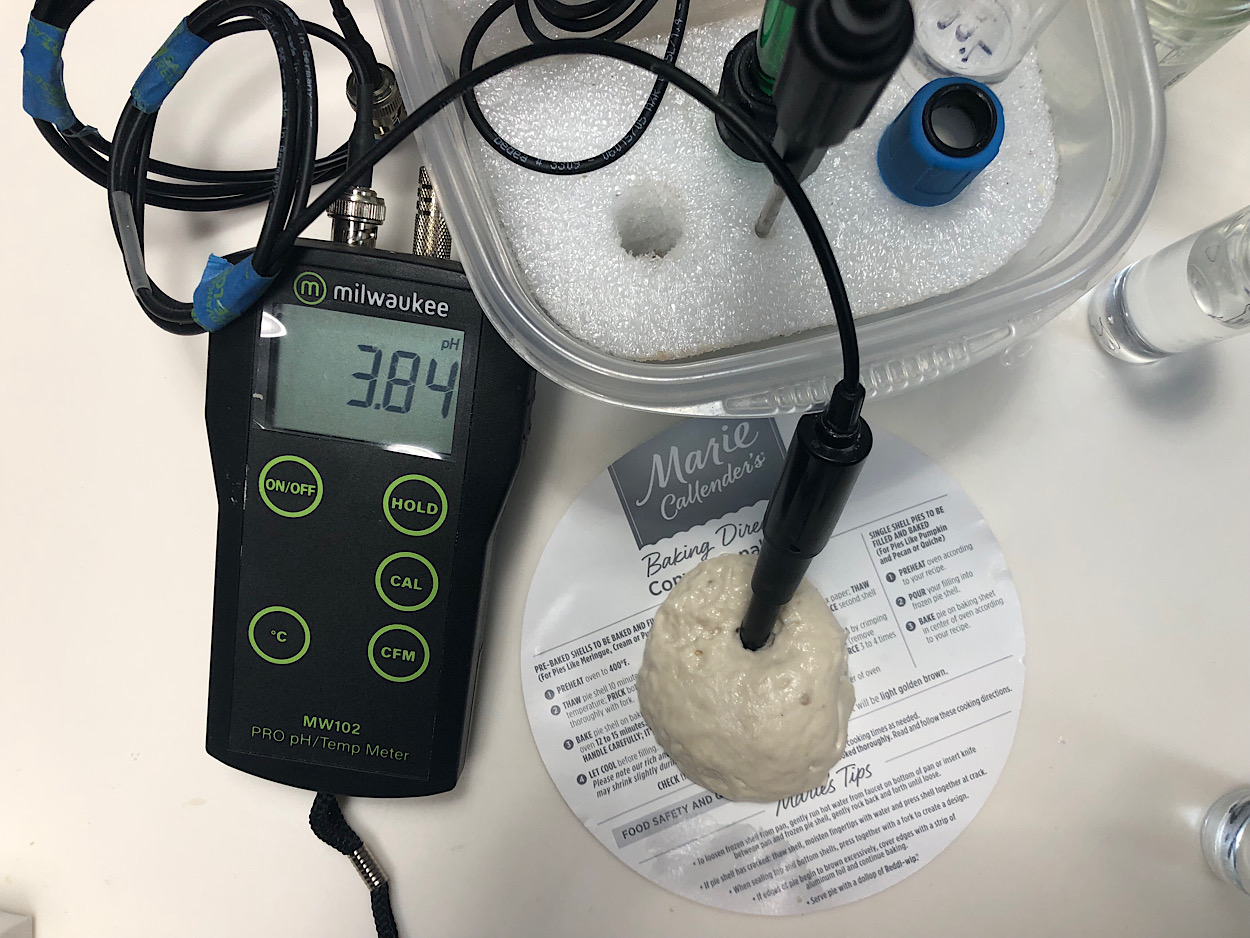
The original starter, which is kept @ 1:1:1 and fed once a week (unless it is used to bake, in that case more often) shows a pH 4.19 at maturity. But once refrigerated for a week the pH reading was pH 3.84. A pH drop of 0.37.
- - - Just realized something that wasn’t taken into consideration - - -
After the refreshed starter matures and before it is refrigerated my practice is to add a large pinch (~3-4g flour) is added to the starter for extra feed and also to maintain a stronger starter with less degradation over the following week. I plan to not only measure the pH at maturity, but also after the extra feed is stirred in. The extra flour will probably raise the pH a bit.
QUESTION -
Why is it others commonly report the pH of their refreshed starters higher than 5? And my refreshed starters are always in the high 4s?
Benny’s answer (whole wheat and buffering) may answer this question.
- DanAyo's Blog
- Log in or register to post comments
Thank you for doing the experiment and reporting your results.
Glad you are joining in on this interesting bit of science. What I was doing was just making a sweet stiff levain and keeping my starter 100% hydration 100% whole rye. The idea being that the starter would remain unadulterated and then I would create levains based on the need to work in certain types of doughs. I’m not sure what effect that keeping a sweet starter would have in the long run. The relative decrease in LAB populations might allow less desirable microbes to take hold in your starter…
Benny
Abe, your starter is simply amazing, judging by the first pix. Quadruple rise after 4hr on 1:1:1 - 100% hydration w/no sugar. Its before and after pH values are very safe and spot on. Amazing!
To enhance the yeast in your starter, keep it at 3-6%. Anything above 6% sugar, i.e. more than 6g of sugar per 100g flour, affects the yeast negatively.
"A little sugar, up to three percent, speeds up fermentation. The yeast processes the added sugar first, saving the time it would take to break down starch into sugar. With over three percent sugar, however, the fermentation rate no longer increases.
Above six percent, sugar actually decreases the rate. This is because the sugar begins to dehydrate the yeast cells. This effect is called crenation."
https://foodchemblog.com/yeast-and-sugar/
mention using 5-20% sugar in theirs. (The segment starts at 49:38) I don't have the book, but it would be interesting to know what they've actually done.
Thanks, watched the whole video. Interesting stuff, maybe learnt a few new tricks
Should read:
Crenation refers to the shape that the cells take on as a result of shrinking. Dehydration is the cause, crenation is the result.
My best,
dw
I always appreciate your knowledge Debra, thanks for always sharing.
Benny
That word takes me back to my years in the clinical laboratory, looking at red blood cells through the microscope :) But in bread yeast, the shape is insignificant to the cause, and since it can't be seen without a microscope, it doesn't really belong in the bread-baking vocabulary.
I.e., the last sentence is inaccurate and should just be dropped.
Many thanks to you as well, for always sharing the details of your bakes. I learn vicariously through you and others since I don't get the opportunity to bake bread as often as I'd like. I wish I had your skills :)
dw
My pleasure as well Debra, I have learned so much from the wonderful community here that includes you. Happy holidays.
Benny
.
Dan your starter in this test appear to have been refreshed with white flour, is that correct? As such they don’t have the buffering capacity of whole grain flours as you know. In my “test” which just happened because I had two similar levains just built with the difference being one had brown sugar while the other didn’t, were 100% whole wheat levains. As such their refreshed pH are much higher than their white flour equivalents. Repeating this test using 100% whole grain will give a much larger delta in pH change over the course of fermentation.
Benny
Yes, strong white flour was used to feed all 3 starters with no whole grains.
The original 1:1:1 lowered pH by 0.33
The stiffened starter 1:1.5:3 lowered pH by 0.84 (I wonder if the extra 2hr it took to mature this starter over the 1:1:1 account for the large drop in pH)
The sugared starter 1:1.5:3:1 lowered pH by 0.33
Hi Danny,
The only comparison you can realistically make here is between the two stiffened starters. And you saw a bigger drop in the one without the sugar, same as Benny did. The reason that the 1:1:1 isn't good for this is that the ratio of starter to fresh flour isn't the same. It is only 1:1 vs 1:3 in the others. Making it 1:3:3 would lengthen the maturation time. It still might not take quite as long as the stiffer version, but would decrease that 2-hr gap, and by raising the initial pH, would increase the overall drop.
Why is it others commonly report the pH of their refreshed starters higher than 5? And my refreshed starters are always in the high 4s?
That initial pH depends on everything you put into the refresh. The acid load you're bringing forward with the starter, the buffering capacity of the flour you're using, and the ratio of starter to flour in your refreshment.
My best,
dw
So, the missing case would be for the 1:1 starter with sugar and without. What do you think, Dan?
Test the differences between 50% hydrated starters using; #1 - no sugar, #2 - 3% sugar, #3 - 6% sugar, #4 x 12% sugar, & #5 - 24% sugar.
White sugar was used.
The starter used in the test is 50% hydrated
The percentage of sugar is calculated by adding the flour in the starter (50% hydrated) and the feed flour.
The starters are fermented @ 80F
NOTE - the large numbers used in items #1-5 are for simplicity and ease of understanding.
The numbers will be divided by 10, so 10:5:10:0.45 for item #2.
The goal of this test -
Learn the affects of various percentages of sugar on 4 starter, compared to the non-sugared starter
Starter to be used for all 5 test samples -
Fed 50% white starter 1:1:2. Fermented @80F for 6hr till mature. pH at maturity - 3.97.
Observation -
Sugar gives the dough a slimy feeling and is sticky. The starter with 24% sugar is messy to knead by hand.
#1 - 5hr to maturity, rise = 3.9x
#2 - 5hr to maturity, rise = 2.8x
#3 - 5hr to maturity, rise = 3.0x
#4 - 7hr to maturity, rise = 2.6x
#5 - 7.5hr to maturity, rise = 3.2x NOTE - this starter may have risen slightly more if given more time. It was after midnight and I was tired :)
How the rise was calculated -
The height of each starter was estimated by eye. A mark was placed on the glass at the level that the dough would max out if the top of the dome relaxed and filled in the voids on the lower sides. With each glass empty and tared on a 0.02 resolution digital scale, the glass was filled to the low mark and noted. Then the glass was filled up to the high mark. The low level weight (in grams) was divided by the high level weight to get the percentage of rise.
The strength characteristics of each starter was very similar - strong dough. Although #5 was a bit more sticky due to the high % of sugar.
Flavor comparison -
Referring to the Emily Buehler reference that Mariana posted above. Considering how many bread formulas have 3% or more sugar by bakers math, this doesn't seem to slow fermentation at all. So then I thought it has to be relative to the water. but that doesn't make sense either. This is about osmotic stress, so it would have more impact in a stiff dough than a highly hydrated one where water is more available. I looked in the comments for some clarity:
I suspect that the reference Emily was going from was in the context of a specific defined set of parameters (as most studies with microorganisms are), and the 3% and 6% were the result of one particular study. But with sourdough, everything is conditional or relative to something else, and so the targets are always moving. I will be eagerly awaiting your findings with your set of parameters.
It's never that simple with living things :)
dw
To Debra's point about sugar expressed in term's of bakers math, I would say the important physiological parameter for osmotic pressure would be the sugar concentration, or sugar amount relative to the amount of water it is dissolved into and NOT the amount of flour involved.
So, if we look at the figures in those terms:
Benny's original post said:
"So getting to the point I made a sweet stiff levain last night at this ratio 1:1.33:2.9:1 starter:water:flour:brown sugar."
If we assume the starter is 100% hydration, or is half water that would make his sugar concentration relative to the amount of water it is dissolved into:
1 / (0.5 + 1.33) = 0.54, or 54%
----------------
Comparing it to Dan's second experiment, container number 5, the one with the highest amount of sugar, and assuming his initial starter is at 50% hydration (so 1/3rd water):
5. 100:50:100:36 24% sugar (starter:water:flour:sugar)
36 / (33.33+50) = 0.43, or 43% sugar concentration
Even Dan's highest sugar level was less concentrated.
(Edit: Dan did state that he started with a 50% hydration initial starter, so adjusted the calc)
Very good point Jon, Dan's highest sugar concentration didn't go nearly as high as my sweet starter. Yes my starter is kept at 100% hydration so your calculations are correct Jon and that totally makes sense. It is the concentration of sugar that is the variable of concern for osmotic pressure.
Jon, after testing I don‘t see a reason for me to use high concentrations of sugar in a starter or levain. I’m not seeing the benefit.
Interesting that your experiment shows very little effect of adding sugar up to 24% at a hydration of 50%. My sweet stiff starter with sugar 29% and 53% hydration definitely showed a very very small pH drop at peak and this was reproducible data as I repeated the testing on a second sweet stiff starter. Now my sugar used was brown sugar so in fact the osmotic pressure may have been different from the osmotic pressure elicited by white sugar. I wonder if the threshold for dehydrating the LAB and yeast is in fact higher than 24% sugar?
This was also done at 1:1 starter:flour in contrast to 1:3 like yours was (and with his cultures and his flour, etc.). 1:1 doesn't allow as much latitude to separate the key players, meaning it was a very short distance from start to finish in this race. And just as important to note is that the large inoculation also means that a significant amount of the acid in the pH determinations was actually created by fermentation prior to the start of this experimental run.
Excellent points as well Debra.
But let's rearrange the data so that you can see what I see.
Sample Sugar Time in Rise Ending Change in
# % hrs x pH pH
1 0 5 3.9 3.95 0.66
2 3 5 2.8 3.91 0.71
3 6 5 3.0 3.82 0.70
4 12 7 2.6 3.96 0.62
5 24 7.5+ 3.2+ 3.98 0.56
When you added small amounts of sugar, it had an invigorating effect on the LAB and a suppressive effect on the yeast. But this is where things aren't always as they appear, and the law of unintended consequences comes to play. Or intended, depending on how you use it.
The sugar (sucrose) is made up of glucose and fructose in equal measure. LAB utilize fructose to make more energy for themselves. But in the process it means more acetic acid is produced, and that is inhibitory to yeast. The yeast are depressed here in 2, 3 and probably 4, not because of osmotic stress from the sugar, but because of increased acetic acid from the LAB. The sugar starts to have a negative impact on the LAB somewhere between your 6 and 12%, and then you start seeing both pH and rise go up, even if there's a delay in getting there.
You commented that the taste was not detectably sweet at maturity. What about levels of sourness? Did they follow the change in pH?
Thank you for reporting your findings, Danny
dw
Debra, all 5 starters were placed in the fridge @38F 1.5 days ago. They were removed and tasted. They are scored from 1-10. 10 meaning the most sour, sweet, or sticky.
In most cases the differences were negligible.
Below are my best guesses.
Starter
Sweetness
Sourness
Stickiness
1
1
1
0
2
0
2
0
3
1
0
2
4
3
0
4
5
7.5
0
6.5 & a little wet
Since #5 was very sweet, am I correct to assume that this starter had plenty enough food to ferment longer?
When looking at the data (your table and mine) have you any other thoughts?
Since #5 was very sweet, am I correct to assume that this starter had plenty enough food to ferment longer?
There certainly is enough sugar, but food isn't usually the issue in starters and levains. Unless a flour is deficient in nutrients or enzymes to break them out, the limiting factor is more likely to be the buildup of inhibiting substances or disintegration of gas-holding structure. I don't really know how a very high sugar environment affects enzymes. They need water to do their job too.
When looking at the data (your table and mine) have you any other thoughts?
Sample Sugar Time Rise Start End Change ------ Perceived ------
# % hrs x pH pH pH Sweet Sour Sticky
1 0 5 3.9 4.61 3.95 0.66 1 1 0
2 3 5 2.8 4.62 3.91 0.71 0 2 0
3 6 5 3.0 4.52 3.82 0.70 1 0 2
4 12 7 2.6 4.58 3.96 0.62 3 0 4
5 24 7.5+ 3.2+ 4.54 3.98 0.56 7.5 0 6.5 (wet)
This time I've added back your starting pH in addition to your tasting results so that we can view everything together, starting in the sweet/sour/sticky columns. Stickiness clearly follows the sugar %, and sugar is known to loosen doughs and create a wetter effect, so that is as expected. I put 'perceived' up there, because it can be difficult enough to assess sweet and sour by taste alone, but even more so in combination --- i.e., enough sweetness can overcome sourness to our senses, and vice versa. (Also, if you tasted them cold from the fridge, that affects the taste intensity too.)
In #1 there is no added sucrose, so any sweetness detected there is from free sugars in the flour and enzyme liberation from complex carbs. #2 had the biggest drop in pH, so it follows that there should be some sourness there, and it was probably easier to pick out given that you found no noticeable sweetness. Maybe the small amount of sugar was entirely consumed, or maybe its taste was masked by the acidity; or something in between. Without measurements of both sugar concentration and TTA we really have no way of knowing which.
#3 is the question mark, because it had the lowest ending pH, and about the same change in pH as #2, good evidence that there was at least as much acid there even if pH can't tell you how much or in what proportion. So, did it dissipate in the 1.5 days of storage (knowing the TTA and FQ would be more helpful than pH here), or is it just masked by the noticeable sweetness? Beyond that it just keeps getting sweeter and less acidic. #4 is similar in that there is evidence of acid there comparable to #1 (where you found some sourness), but the level of sweet is a couple notches higher. I think these two tastes are most likely confounding each other.
After sweet vs sour, we need to look at time vs maturity and the human element. Time can be precisely measured, but maturity is a subjective thing. They are two sides of the same coin in that when degree of maturity is the endpoint, fermentation time is the variable; and when time is the endpoint, maturity is variable. This illuminates one of the divides between science and baking --- scientists generally go by the clock whereas bakers go by the dough, because at the end of day, the goal is good data as opposed to good bread.
So, what makes for good data? Besides well-defined parameters and procedures, it helps to have calibrated instruments that are accurate and precise. Unfortunately, most of us don't have that in our kitchen scales, and that's what your starting pH column shows. Since the formula and ingredients were the same in all five samples, and the sugar is increased in regular amounts, the pH data in this column should either be all the same, or trending smoothly in one direction. And since that isn't the case, we have to judge the rest accordingly That's why I added the change in pH to your data.
For future testing, I think precision will be more important than accuracy in this kind of kitchen science. And this is because it will be the patterns and relationships that you take away and apply in baking. As I said above, the numbers are situation specific. Everything in sourdough is conditional or relative to something else, and so the targets are always moving. The easiest way to improve precision would be to mix one big batch of levain, and then divide it into as many samples as you need, adding the appropriate measure of sugar to each aliquot (weighing on a micro scale if you have one). But what this experiment has shown is that to get the answers you originally set out to find, you will need to go higher on the sugar concentration as the others have already pointed out. Depending on your intended application, maybe that's a deal-breaker. But it doesn't make the results of this run any less valuable for what they show. I wouldn't mind seeing more points in between these so that some curves could be graphed ...
I would also cut down the initial inoculation to let it ferment longer and reduce the amount of acid you bring forward from previous cycles in order to see more of the effect from fermentation and growth in the conditions you are actually testing. You could try to judge peaks as you did, and measure the heights and times to get there, but maturity is more of a range than a point and may look different in the different samples. Or you could run all samples for 12 or 24 hours, whatever is appropriate, recording time/height all along the way. That way you capture not only the highest point and how fast it gets there, but how long it stays there. pH readings would have to be taken at the end, all at the same time so as not to interrupt the rise. It's a tradeoff but would still reveal relationships. Just keep in mind that rise height/rate in a high sugar levain won't necessarily reflect its true leavening power when put into a less stressful final dough.
It's never that simple with living things :)
dw
I suspect that the low hydration sourdough used to make pannetone (once fully mature) uses natural selection favoring osmotolerant yeast that is better able to survive the stress that sweet doughs put on traditional levain and standard commercial yeast. (they make osmotolerant commercial yeasts)
If the goal of this exercise is to make a starter for sweetbreads that can tolerate high sugar concentrations, a lievito madre might be a great starting point.